Help:Investigation Import From File: Difference between revisions
No edit summary |
(Added to the wiki via WikiImport-Script.) |
||
| Line 1: | Line 1: | ||
== What can be imported? == | == What can be imported? == | ||
Investigations are basically tables of data describing experiments. The columns represent the properties of the experiments, each row is a new experiment. That means they can be represented as Excel sheets. | Investigations are basically tables of data describing experiments. The columns represent the properties of the experiments, each row is a new experiment. That means they can be represented as Excel sheets. | ||
Each type of investigation needs a particular set of properties. The Excel templates of these properties for the different types are listed below. Important to note is the handling of molecules. They are represented by their InchI-Key as well as by (one of) their MOLFILE-representation. The latter is necessary to display the molecule. That means that the columns for molecules appear always as 2 columns in the excel file. First the column for the InchI-Key followed by the column of the MOLFILE. The latter has the suffix "_data". For example: The property "Catalyst" of the investigation would appear in the excel sheet with the column "Catalyst" and "Catalyst_data" | Each type of investigation needs a particular set of properties. The Excel templates of these properties for the different types are listed below. Important to note is the handling of molecules. They are represented by their InchI-Key as well as by (one of) their MOLFILE-representation. The latter is necessary to display the molecule. That means that the columns for molecules appear always as 2 columns in the excel file. First the column for the InchI-Key followed by the column of the MOLFILE. The latter has the suffix "_data". For example: The property "Catalyst" of the investigation would appear in the excel sheet with the column "Catalyst" and "Catalyst_data" | ||
Revision as of 13:05, 22 November 2024
What can be imported?
Investigations are basically tables of data describing experiments. The columns represent the properties of the experiments, each row is a new experiment. That means they can be represented as Excel sheets.
Each type of investigation needs a particular set of properties. The Excel templates of these properties for the different types are listed below. Important to note is the handling of molecules. They are represented by their InchI-Key as well as by (one of) their MOLFILE-representation. The latter is necessary to display the molecule. That means that the columns for molecules appear always as 2 columns in the excel file. First the column for the InchI-Key followed by the column of the MOLFILE. The latter has the suffix "_data". For example: The property "Catalyst" of the investigation would appear in the excel sheet with the column "Catalyst" and "Catalyst_data"
- Example
How it can be imported
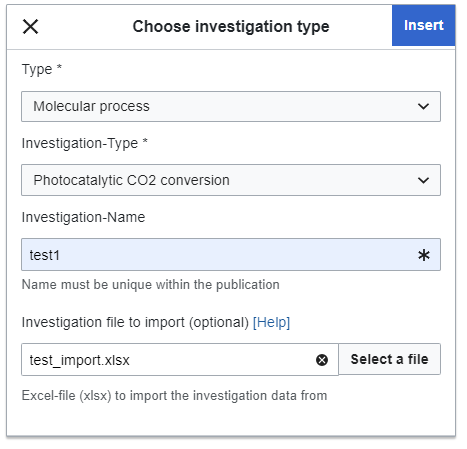
To add a new Investigation, go to the edit mode and select "Investigation" from the "Insert"-menu. You should see this:
You have to select the type of the experiment and the name. At the bottom you can select an Excel file containing the investigation. If you dont select a file, an empty investigation is created. If you click "Insert" with a selected file, it is uploaded to the system and the import process starts in background. This can take several minutes depending on the size of the investigation. Once the import process is finished the page is automatically updated to show the results. Don't forget to save the page afterwards.
Templates for download
Literature
Publication: Visible-light-driven methane formation from CO2 with a molecular iron catalyst
Publication: Toward Visible-Light Photochemical CO2‑to-CH4 Conversion in Aqueous Solutions Using Sensitized Molecular Catalysis
Publication: Visible-Light-Driven Conversion of CO2 to CH4 with an Organic Sensitizer and an Iron Porphyrin Catalyst


